Tracking and Debugging AI Safety Evaluations with Inspect AI and MLflow

AI safety evaluation frameworks like Inspect AI run tasks against language models, score the results, and produce log files. When a sample fails or a model scores differently across versions, debugging means opening JSON and reading through message histories, tool calls, and scoring events by hand. There's no experiment tracking across runs, no visual span tree showing what the model did at each step, and no way to compare two evaluations side by side.
The inspect-mlflow package brings MLflow tracking and tracing to Inspect AI, the UK AI Security Institute's open-source evaluation framework (16M+ monthly PyPI downloads). Install the package, set two environment variables, and every evaluation automatically logs hierarchical runs with metrics, execution traces with span-level visibility, and artifacts. No code changes needed. The package auto-registers through Inspect AI's hooks system via Python entry points.
What Gets Tracked
The tracking hook creates a parent MLflow run for each evaluation, with a nested child run for each task. Every task run captures the model name, dataset, solver configuration, and generation parameters as MLflow parameters. Per-sample scores log as step metrics so you can see accuracy trends across the dataset. Token usage rolls up per model, and event counts track total model calls and tool invocations.
At the end of each task, the hook writes two artifacts: a per-sample results JSON with inputs, outputs, targets, and scores for every sample, and the full evaluation log (minus raw samples) for archival. The screenshot below shows a task run with 17 logged metrics including accuracy, token usage, and event counts:
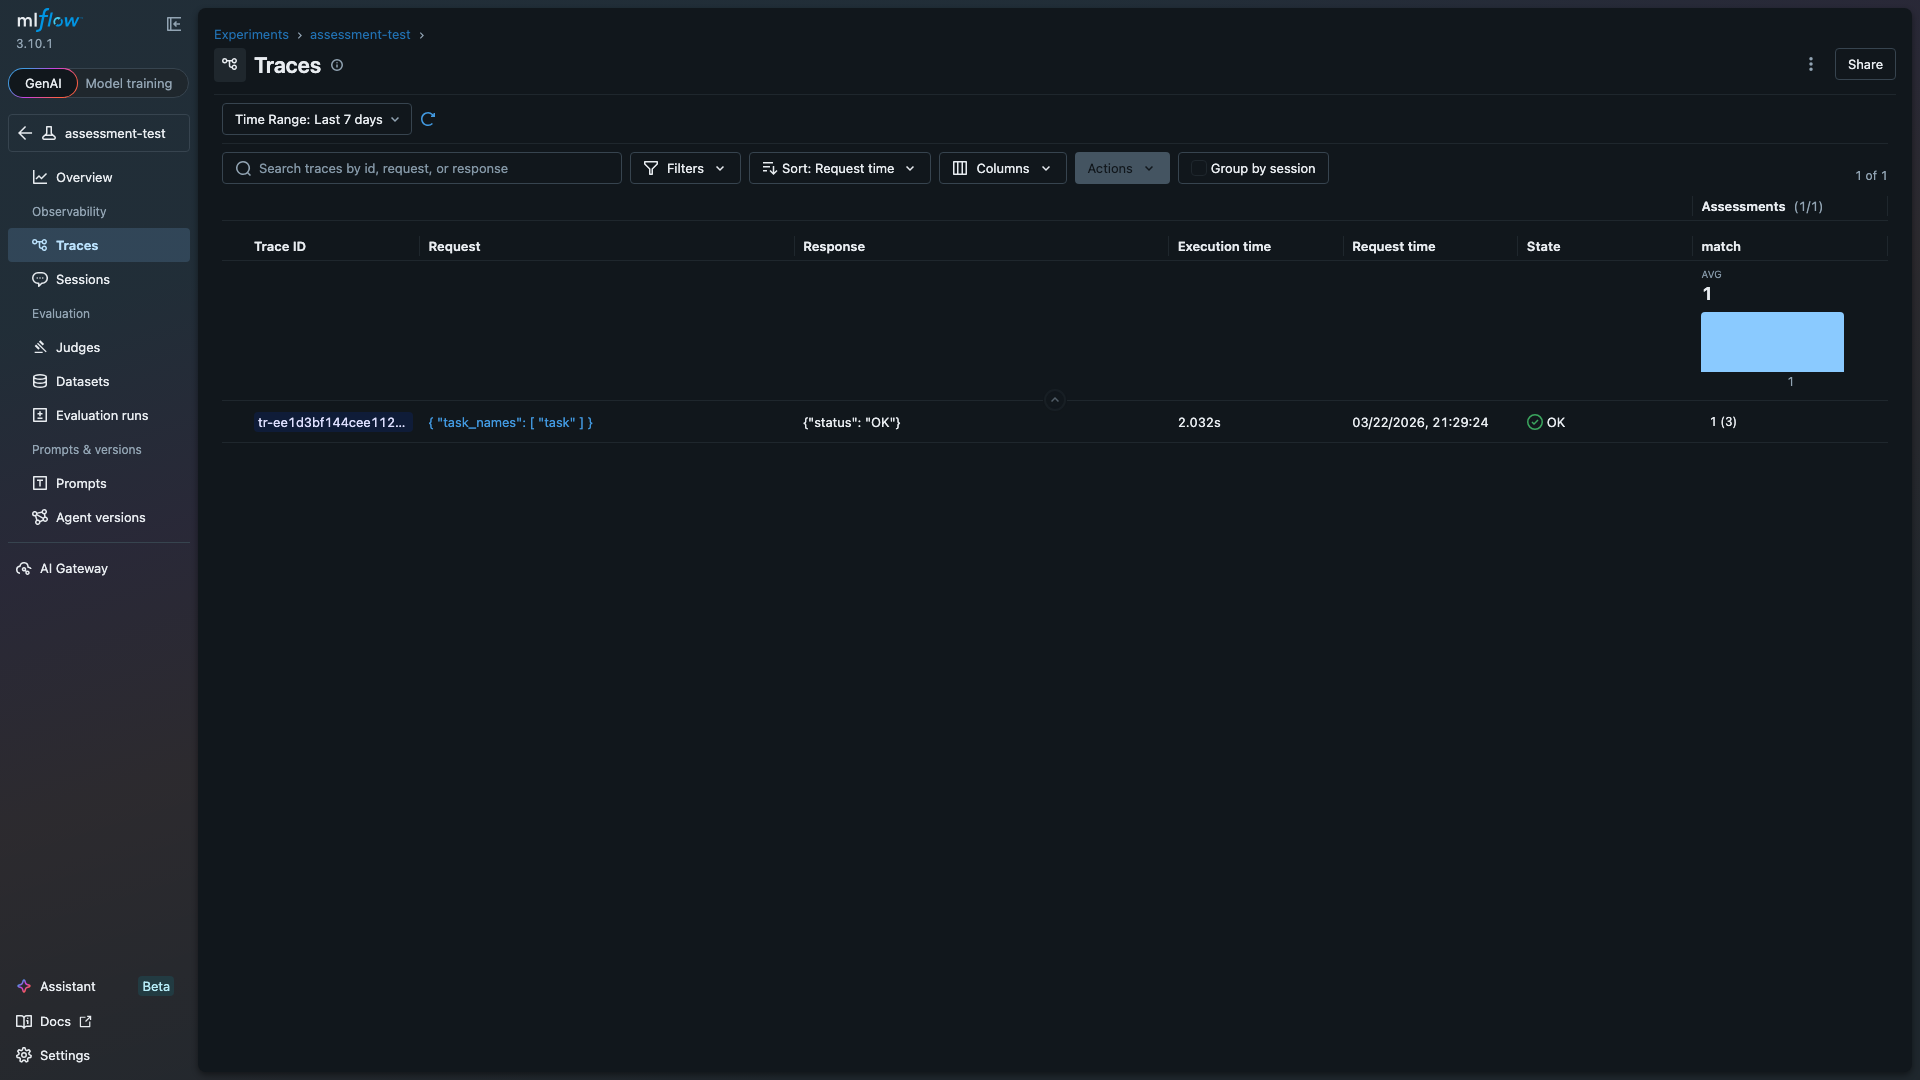
Eval scores also log as MLflow trace assessments, so they appear directly in the Traces table alongside execution time and status. The "match" column below shows the average score (1.0) and per-trace assessment count (3 samples):
Debugging with Execution Traces
Setting MLFLOW_INSPECT_TRACING=true activates the tracing hook, which maps every evaluation event to an MLflow trace span. The span tree mirrors the eval hierarchy:
eval_run (CHAIN)
  task (CHAIN)
    sample (CHAIN)
      solvers -> generate -> model:openai/gpt-4o-mini (LLM)
      scorers -> match -> score (EVALUATOR)
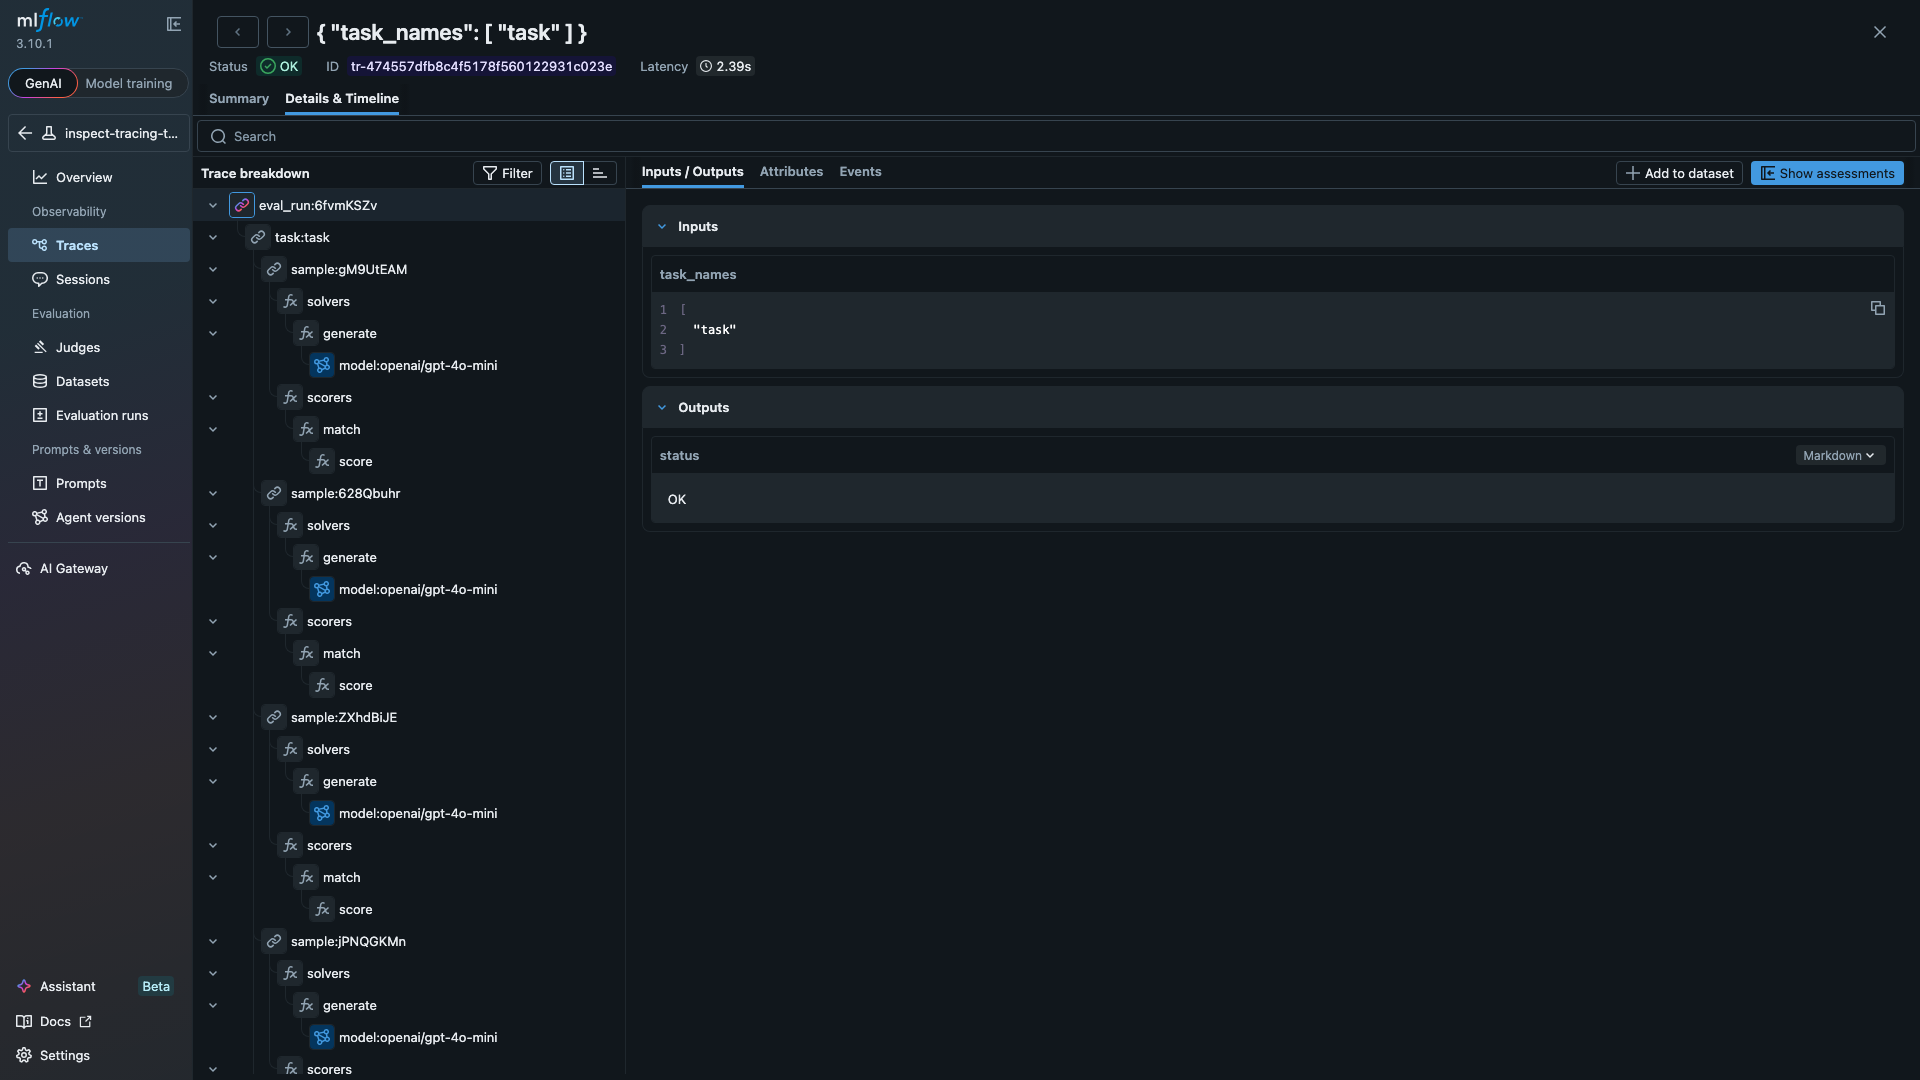
Each span type captures different data. LLM spans record the model name, input and output token counts, temperature, cache status, and the response text. Tool spans show the function name, arguments, result, and execution time. Evaluator spans capture the score value and explanation. The span tree below shows a full evaluation with three samples, each containing solver and scorer spans:
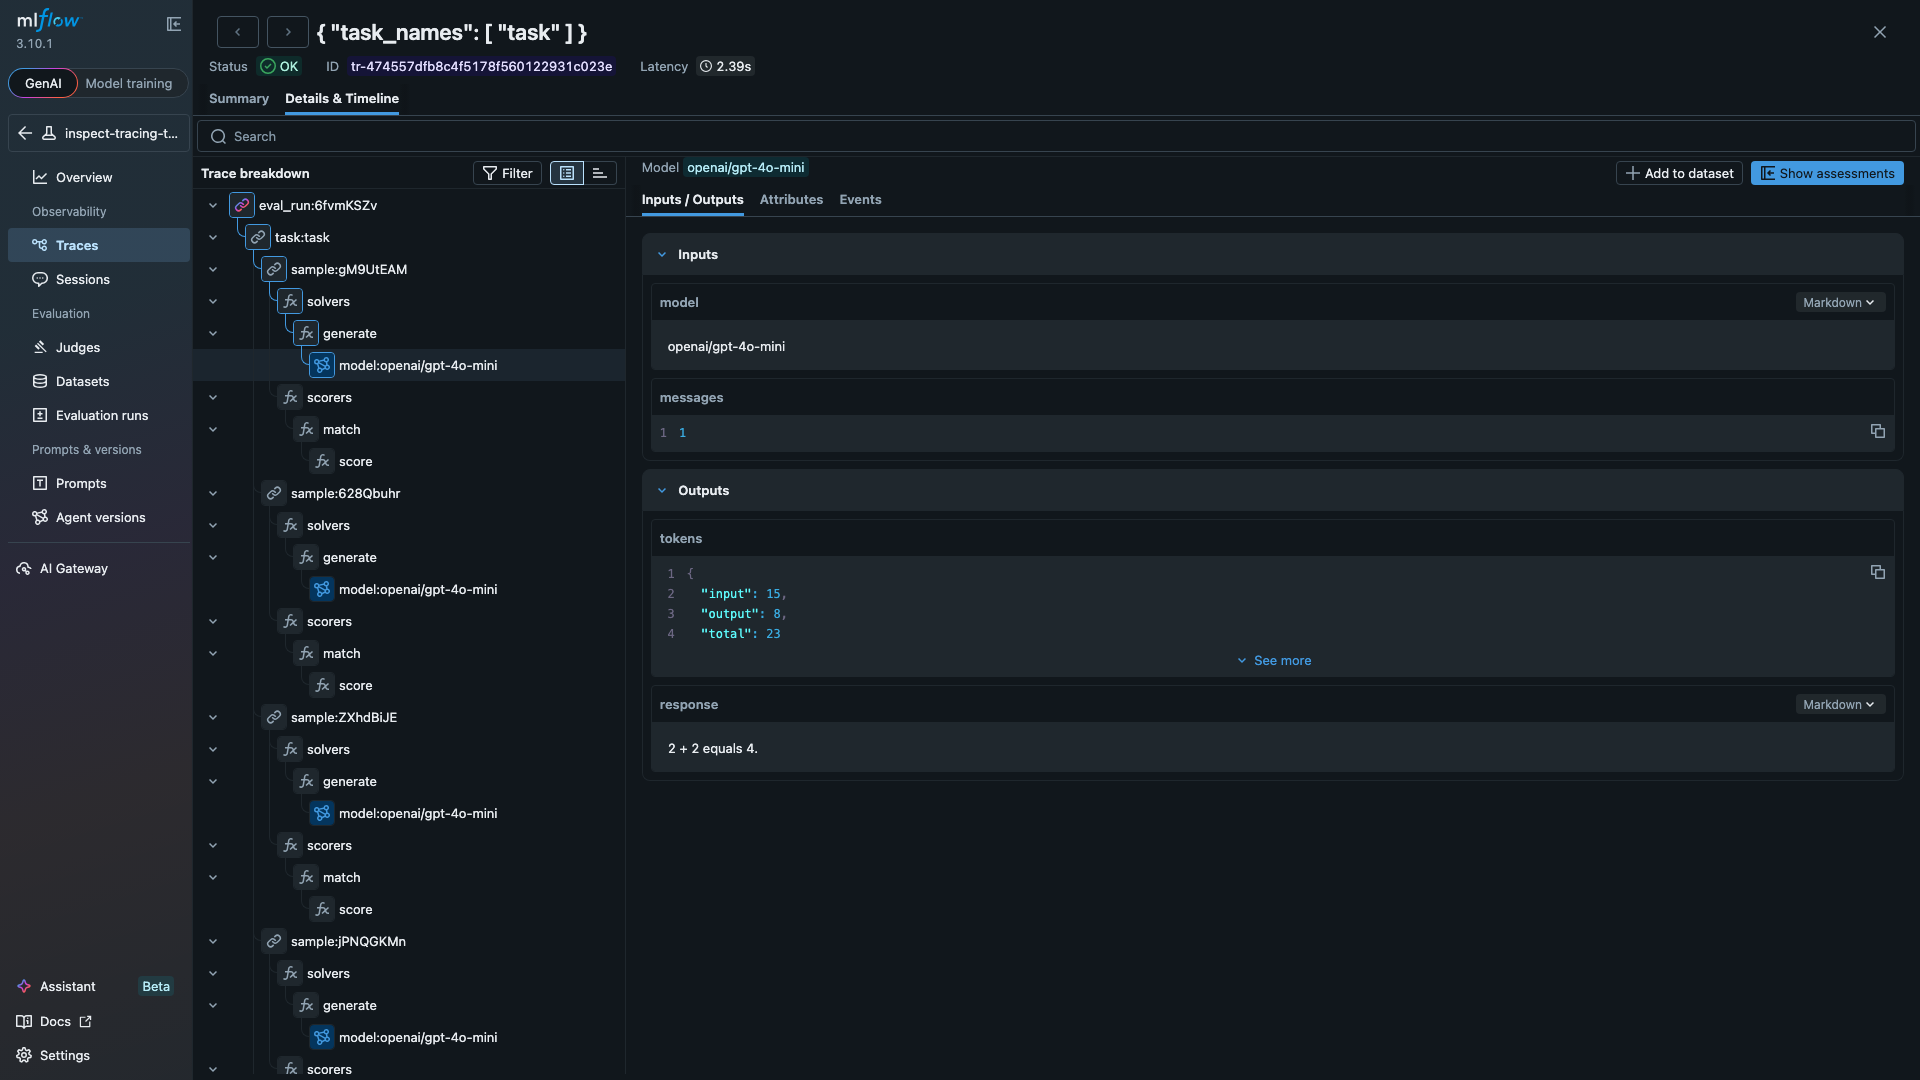
Clicking any span opens its inputs and outputs. The LLM span below shows a model call that consumed 23 tokens and returned "2 + 2 equals 4.":
The tracing hook handles tool-using agents the same way. Define a tool, add it to your solver, and each tool invocation appears as a TOOL span with the function name, arguments, and returned result:
from inspect_ai import Task, eval
from inspect_ai.dataset import Sample
from inspect_ai.scorer import match
from inspect_ai.solver import generate, use_tools
from inspect_ai.tool import tool

@tool
def calculator():
    """Perform arithmetic calculations."""
    async def run(expression: str) -> str:
        """Evaluate a math expression.

        Args:
            expression: e.g. "47 * 89"
        """
        return str(eval(expression, {"__builtins__": {}}))
    return run

task = Task(
    dataset=[
        Sample(input="Use the calculator to compute 47 * 89.", target="4183"),
        Sample(input="Use the calculator to compute 1024 / 16.", target="64"),
    ],
    solver=[use_tools([calculator()]), generate()],
    scorer=match(),
)

logs = eval(task, model="openai/gpt-4o-mini")
Importing Traces into Scout
Inspect Scout analyzes agent transcripts for safety issues using LLM-based and pattern-matching scanners. The import_mlflow_traces() function pulls MLflow traces into Scout's transcript database, converting LLM spans to ModelEvents, tool spans to ToolEvents, and score spans to ScoreEvents:
from inspect_mlflow.scout import import_mlflow_traces
from inspect_scout import transcripts_db

async with transcripts_db("./safety-analysis") as db:
    await db.insert(import_mlflow_traces(
        experiment_name="my-evals",
        tracking_uri="http://localhost:5000",
    ))
This bridges MLflow's experiment tracking with Scout's safety analysis. Any MLflow-traced evaluation can be imported and scanned.
How It Works
The diagram below shows the data flow. Inspect AI fires lifecycle hooks during evaluation. The tracking and tracing hooks capture those events and write them to MLflow. The Scout import is a separate manual step where users pull MLflow traces into Scout's transcript database for safety analysis.
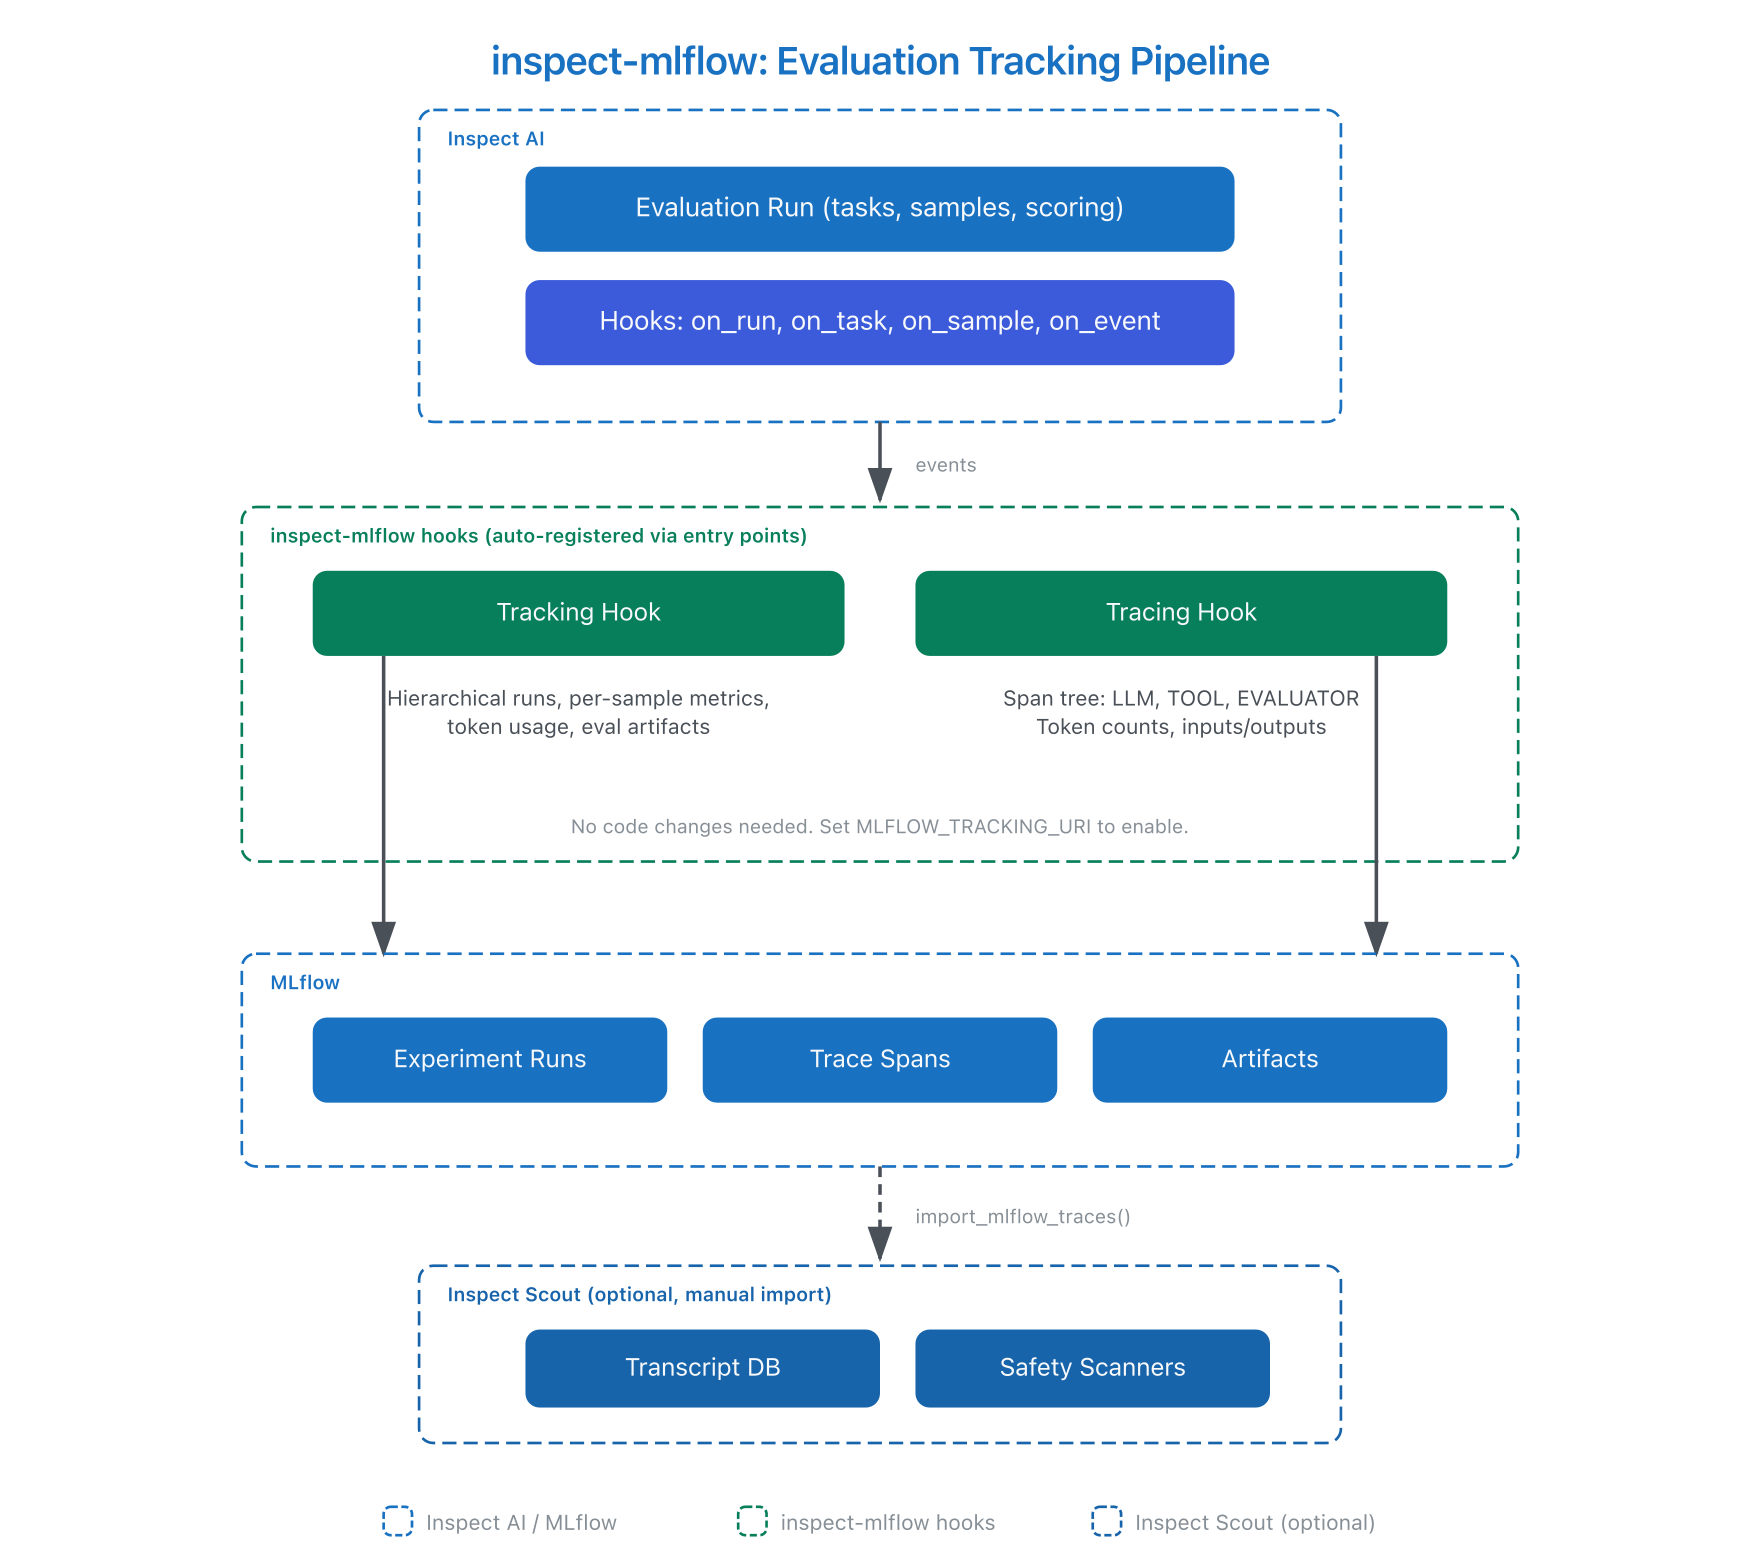
The package registers both hooks via Python entry points. When Inspect AI starts, it discovers and activates them automatically. The tracking hook creates nested MLflow runs. The tracing hook creates a span tree with parent-child relationships that mirror the evaluation hierarchy.
Getting Started
To get started, install the package and point it at an MLflow server:
pip install 'inspect-mlflow' 'mlflow>=3.0'
export MLFLOW_TRACKING_URI="http://localhost:5000"
export MLFLOW_INSPECT_TRACING="true"
inspect eval my_task.py --model openai/gpt-4o
See the package documentation for configuration options and examples.
Resources
- inspect-mlflow on PyPI
- inspect-mlflow documentation
- Inspect AI Extensions
- Inspect AI Hooks Documentation
- Scout MLflow Import Guide
- MLflow Tracing Documentation
Provenance
I (Debu Sinha) built the inspect-mlflow package, which provides MLflow tracking and tracing hooks for Inspect AI evaluations. The integration was developed across four pull requests to the Inspect AI repository (#3433, #3483, #3492, #3548), all reviewed and merged by JJ Allaire (creator of RStudio, Inspect AI lead at the UK AI Security Institute). The hooks build on the extensibility system Allaire designed for Inspect AI and on MLflow's start_span_no_context() tracing API.
After the initial hooks landed, Allaire requested standalone package distribution to simplify installation. The package is published on PyPI as inspect-mlflow and is listed on the Inspect AI Extensions page. Allaire also added an MLflow import section to the Inspect Scout documentation. The package includes a Scout import source that converts MLflow traces into Scout transcripts for safety scanner analysis.
This integration connects two ecosystems with a combined 47M+ monthly PyPI downloads (MLflow: 31M, Inspect AI: 16M). The package follows the entry-point auto-registration pattern used by inspect-wandb and other Inspect AI extensions.
Related artifacts:
- inspect-mlflow on PyPI (published)
- PR #3433: MLflow tracking hook (merged)
- PR #3483: Artifact logging (merged)
- PR #3548: MLflow tracing hook (merged)
- Issue #3547: Package proposal with JJ Allaire's response
- Inspect AI Extensions page (lists package)
- Scout MLflow import documentation (added by JJ Allaire)